How to interpret the on-chain large-position dynamics of tokenized assets?
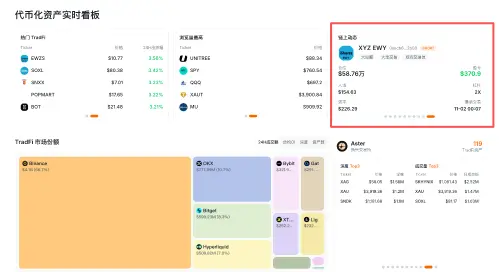
We’ve gone through trending topics and compared venues, and there is another set of public data worth watching: large on-chain position changes. What makes tokenized assets unique is that large trades on stock derivative contracts leave traces on the blockchain. The on-chain activity module of the tokenized asset dashboard broadcasts these large trades in real time: direction, position size, entry price, leverage, and profit/loss. On-chain large-position data objectively reflects public trading activity and can serve as one dimension for tracking capital flows.
Who is this article for?
• Individual investors who wish to incorporate on-chain data into their research;
• Active traders who track large-scale position movements;
• Analysts studying capital flows.
What do on-chain activity updates show?
Each on-chain activity update records a significant contract-based transaction associated with a specific address. Key data fields include:
• Direction (Long/Short): The direction in which the position was opened.
• Position Size and Leverage: The scale of capital and risk exposure—for instance, a $1 million position with 5x leverage carries a completely different risk profile than a $100,000 position with 50x leverage.
• Entry Price and Unrealized PnL: The current profit or loss status of the position.
• Liquidation Price and Timestamp: The risk threshold (liquidation price) and the time the transaction occurred.
By tracking a single address over time, you can gain a more comprehensive view of its behavioral patterns, such as trading frequency, holding duration, and the cadence of adding to or closing out positions.
Three Ways to Use This Data
Use Case 1: As an additional observational dimension. Comparing the direction of large positions against your own research conclusions can provide useful context, though it should not serve as the sole basis for your trading decisions.
Use Case 2: Monitoring behavioral shifts. Significant activity from an address that is typically inactive, or a cluster of large, directional trades across multiple addresses, warrants note and ongoing observation.
Use Case 3: Cross-referencing with other metrics. When large positions emerge within a specific sector or on a particular exchange, compare them against indicators like funding rates or trading volume. Combining these dimensions—sector, exchange, and position data—provides a more complete picture than looking at any single metric alone.
Three Important Limitations
1. Do not copy-trade: By the time you see a large position, it may have already changed; public on-chain data is subject to latency.
2. A single trade is not evidence of a trend: One large transaction does not constitute proof of a broader trend; meaningful insights only emerge from continuous observation.
3. Avoid isolated analysis: Position data is most valuable when cross-referenced with other factors like price, market depth, and funding rates. Every individual data source has its inherent limitations. Usage Limitations
• On-chain activity serves as an objective reflection of public actions and does not constitute investment advice. Data timeliness is subject to the information currently displayed on the Tokenized Assets Dashboard. For definitions of specific data fields, please refer to the Tokenized Assets FAQ.
• Large-scale transactions do not indicate future market trends; historical behavior should not be used to predict future outcomes.
Create Your Own Observation Notes on Large Positions
Open the Tokenized Assets Dashboard, review the "On-Chain Activity" section, and note the assets showing significant directional movement today, along with their respective leverage levels—this marks the start of your first set of observation notes. Beyond position data, if you are interested in comparing costs and liquidity across different trading venues, please see "How to Compare Costs and Liquidity for the Same Tokenized Asset Across Different Trading Venues?"—part of our research methodology series focused on the tokenized asset sector.